一、环境说明
1. 基础环境
- OpenStack 版本:Rocky
- 部署模式:All-in-One
- 操作系统:CentOS Linux 7.9.2009
- 虚拟化:KVM + libvirt
- 网络:宿主机可访问 OpenStack 虚拟机管理网段
2. 目标
- 使用 Prometheus 采集监控指标
- 使用 Grafana 进行可视化
- 监控内容包括:
- 宿主机(CPU / 内存 / 磁盘)
- OpenStack 虚拟机实例(CPU / 内存 / 网络)
- 为后续 实例能耗估算 做数据准备
二、整体架构
+--------------------------------------------------+
| OpenStack Rocky All-in-One (CentOS 7.9)          |
|                                                  |
|  +----------------+     +--------------------+  |
|  | node_exporter  | --> |                    |  |
|  | (9100)         |     |                    |  |
|  +----------------+     |                    |  |
|                          |   Prometheus       |  |
|  +----------------+     |   (9090)            |  |
|  | libvirt_exporter| --> |                    |  |
|  | (9177)         |     |                    |  |
|  +----------------+     +--------------------+  |
|                                                  |
|                     +--------------------+       |
|                     | Grafana (3000)     |       |
|                     +--------------------+       |
+--------------------------------------------------+
|
三、部署 node_exporter(宿主机监控)
1. 下载与解压
cd /opt
wget https://github.com/prometheus/node_exporter/releases/download/v1.7.0/node_exporter-1.7.0.linux-amd64.tar.gz
tar xf node_exporter-1.7.0.linux-amd64.tar.gz
ln -s node_exporter-1.7.0.linux-amd64 node_exporter
|
2. 启动
cd /opt/node_exporter
./node_exporter &
|
3. 验证
ss -lntp | grep 9100
curl http://localhost:9100/metrics | head
|
确认 9100 端口监听成功。
四、部署 libvirt_exporter(实例级监控)
1. 前置依赖(非常关键)
yum install -y libvirt-devel libvirt-daemon-devel pkgconfig gcc
|
2. 编译 libvirt_exporter
cd /opt
git clone https://github.com/Tinkoff/libvirt-exporter.git
cd libvirt-exporter
go build -o libvirt-exporter
|
3. 启动 exporter
./libvirt-exporter --libvirt.uri="qemu:///system" &
|
4. 验证实例指标
curl http://localhost:9177/metrics | grep instance
|
应能看到类似:
libvirt_domain_info_cpu_time_seconds_total{domain="instance-0000xxxx"} ...
|
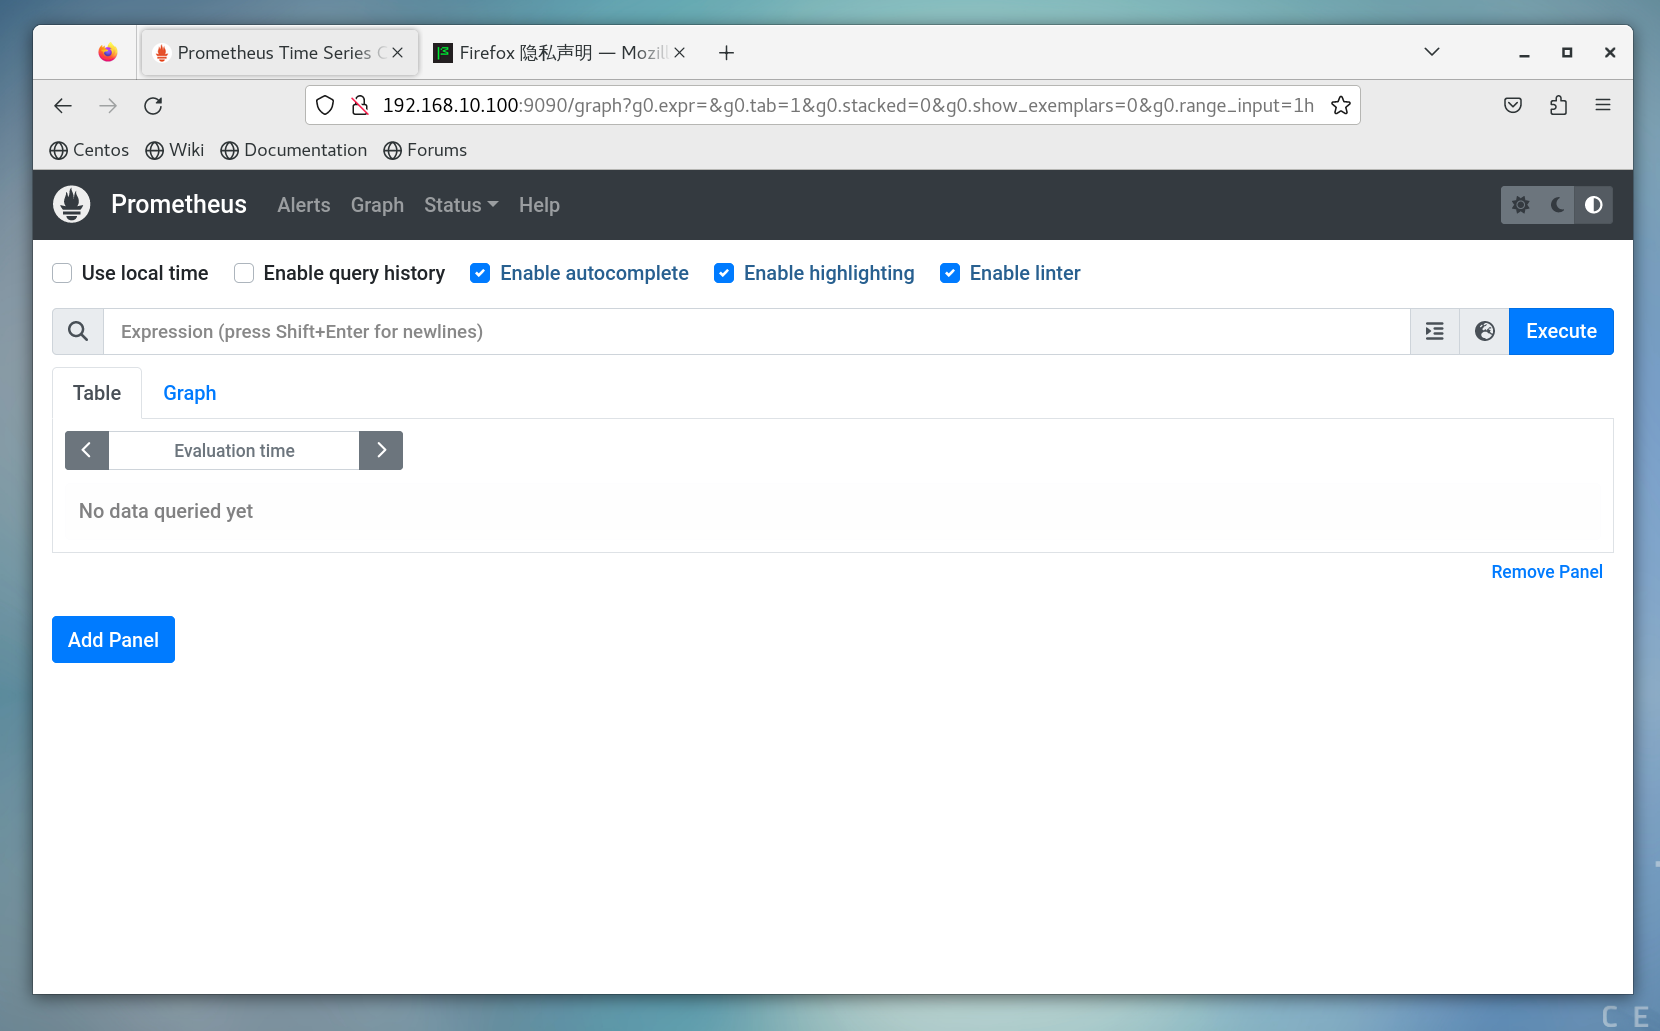
五、部署 Prometheus
1. 安装
cd /opt
wget https://github.com/prometheus/prometheus/releases/download/v2.48.0/prometheus-2.48.0.linux-amd64.tar.gz
tar xf prometheus-2.48.0.linux-amd64.tar.gz
ln -s prometheus-2.48.0.linux-amd64 prometheus
|
2. 配置文件 /opt/prometheus/prometheus.yml
global:
  scrape_interval: 15s

scrape_configs:
  - job_name: "node-exporter"
    static_configs:
      - targets: ["localhost:9100"]

  - job_name: "libvirt"
    static_configs:
      - targets: ["localhost:9177"]
|
3. 启动 Prometheus
/opt/prometheus/prometheus \
  --config.file=/opt/prometheus/prometheus.yml &
|

六、部署 Grafana
1. 安装
yum install -y https://dl.grafana.com/oss/release/grafana-10.2.3-1.x86_64.rpm
systemctl enable grafana-server
systemctl start grafana-server
|
2. 访问
http://<OpenStack_IP>:3000
|
默认账号:
3. 添加 Prometheus 数据源
- URL:
http://localhost:9090
- Save & Test → Success
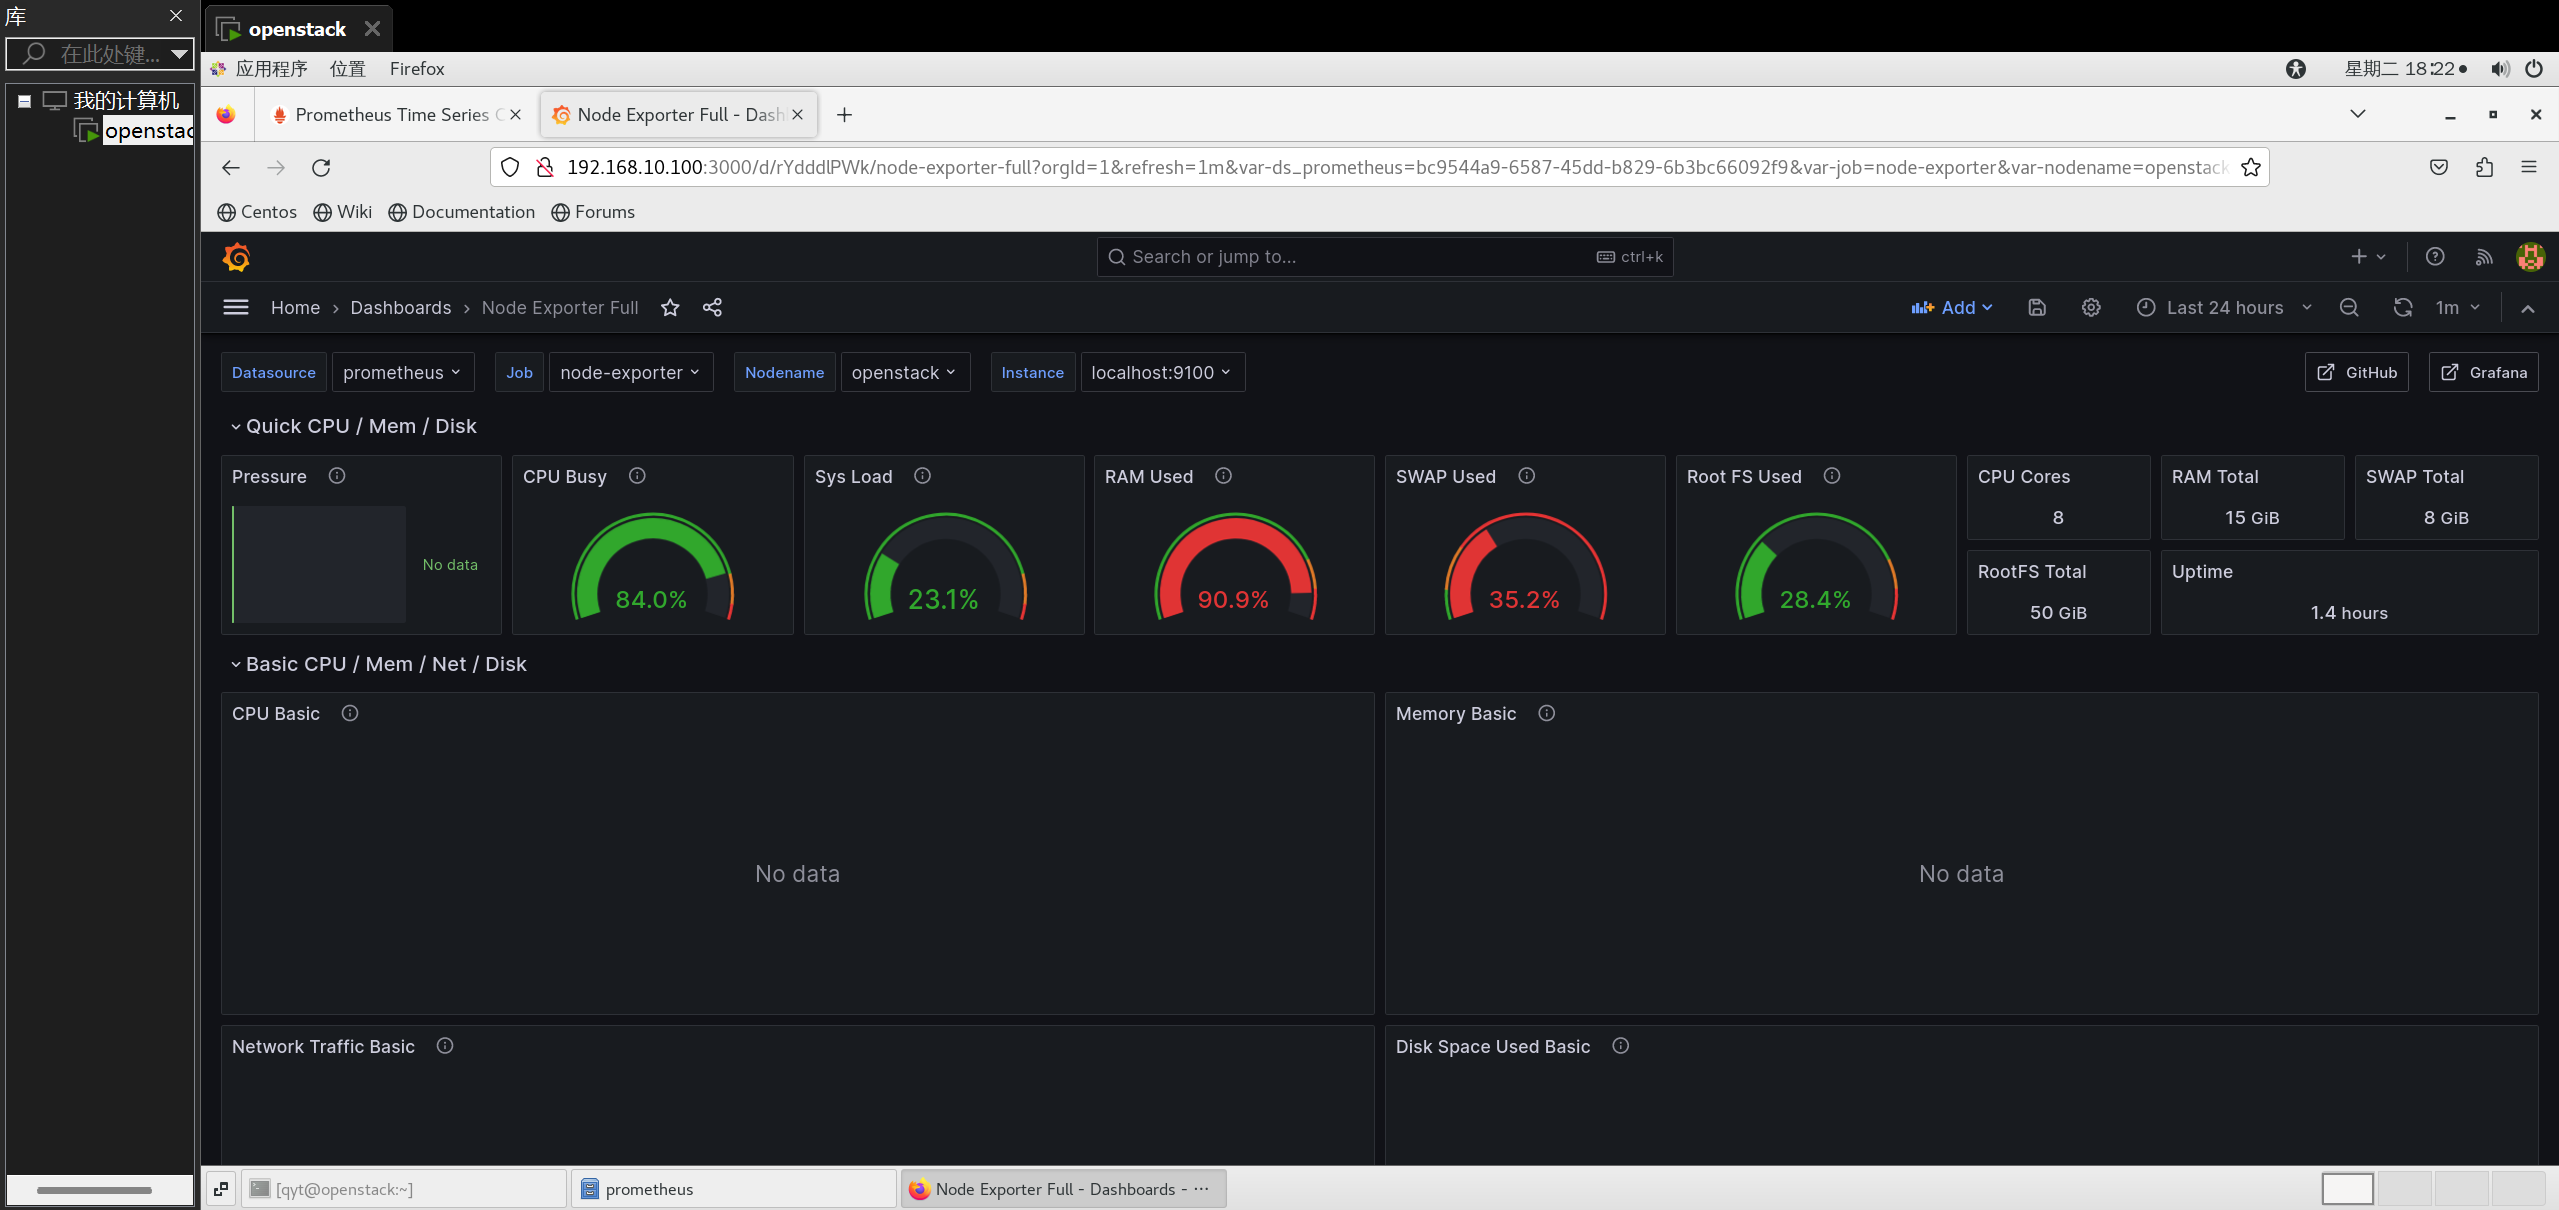
七、Dashboard 使用说明
1. Node Exporter Full(宿主机)
- Dashboard ID:1860
- 注意事项:
- Prometheus 中的 job 名称需为
node-exporter
- 导入后必须选择:
- 常见问题:
- No data ≠ 没采集数据
- 多数是变量未选择或 job 名不匹配
2. libvirt 实例监控
公共 Dashboard 在 libvirt 场景下假设差异较大,
最终采用 自定义 Dashboard,直接基于以下指标:
libvirt_domain_info_cpu_time_seconds_totallibvirt_domain_memory_stats_used_percentlibvirt_domain_interface_stats_*
确保:
- 不依赖固定 job 名
- 直接按
domain 标签区分实例